Mientras el crudo sigue al alza, continúa el desplome del GAS natural
- Iniciador del tema droblo
- Fecha de inicio
Pasaba por aqui
Well-Known Member
Pasaba por aqui
Well-Known Member
droblo
Administrator
No soy profeta pero la tendencia es bajista y además la bajada generlizada de las materias primas coincide con unos peores datos económicos globales que indican desaceleración donde se crecía y recesión en Europa.
A no ser que la noticia de la rebaja de los requerimientos de capital a la banca en China influya en la apertura del lunes lo normal es que se abra con cesiones moderadas en bolsa y crudo. Y con esto te contesto a tu otra pregunta, la bolsa americana está muy tocada desde hace 2 viernes por el dato de empleo y Europa no aporta alegrías, sólo la noticia china podría provocar algún rebote el lunes en apertura. Luego en la sesión puede pasar de todo.
A no ser que la noticia de la rebaja de los requerimientos de capital a la banca en China influya en la apertura del lunes lo normal es que se abra con cesiones moderadas en bolsa y crudo. Y con esto te contesto a tu otra pregunta, la bolsa americana está muy tocada desde hace 2 viernes por el dato de empleo y Europa no aporta alegrías, sólo la noticia china podría provocar algún rebote el lunes en apertura. Luego en la sesión puede pasar de todo.
Pasaba por aqui
Well-Known Member
EIA provides new information on planned natural gas pipelines and storage facilities ›
On May 10, 2012, EIA published new information on planned additions to natural gas pipeline capacity and natural gas storage facilities. EIA is planning to update this information quarterly. More›


View entire series</SPAN> (</SPAN>1975-</SPAN>2013)

View entire series</SPAN> (</SPAN>1975-</SPAN>2013)
On May 10, 2012, EIA published new information on planned additions to natural gas pipeline capacity and natural gas storage facilities. EIA is planning to update this information quarterly. More›


View entire series</SPAN> (</SPAN>1975-</SPAN>2013)

View entire series</SPAN> (</SPAN>1975-</SPAN>2013)
Última edición:
Pasaba por aqui
Well-Known Member
The Two Models
Economic /Technological Approach. With the economic/ technological approach, the assumption is made that high oil prices will encourage substitution and/or new oil production. Because of this, high oil prices are not expected to persist. Instead, the most important consideration in determining future oil supply is the level of future demand. The level of future demand, in turn, is primarily driven by anticipated GDP growth, since world GDP growth and world oil production growth tend to be highly correlated.
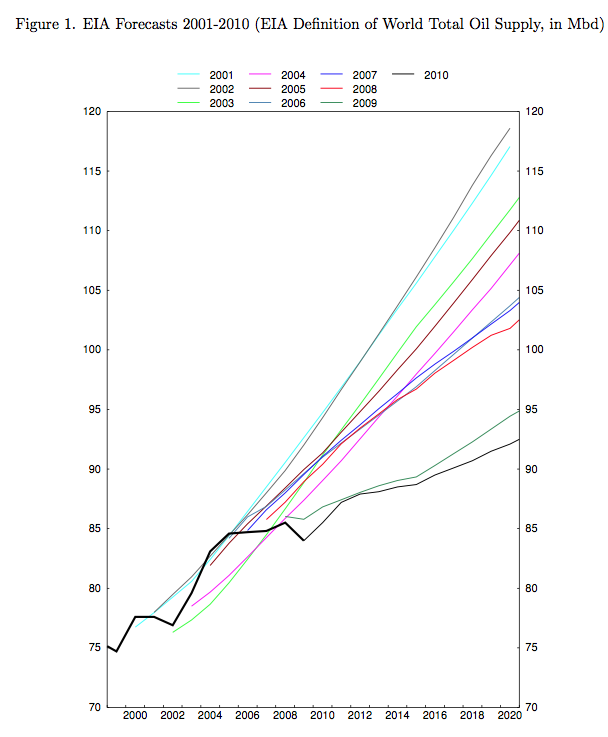
In effect, models of this type assume that whatever oil supply is needed will be available; they don’t consider the possibility that geological considerations may limit oil supply over the long term. As an example of how well these models have worked for prediction, the paper shows a graph of historical EIA forecasts (Figure 1, below).

Figure 1. Graph showing that oil production forecasts by the US Energy Information Administration have been revised downward, year after year, from paper.
Each year, EIA’s forecasts have been adjusted downward, because actual oil supply growth was lower than forecast.
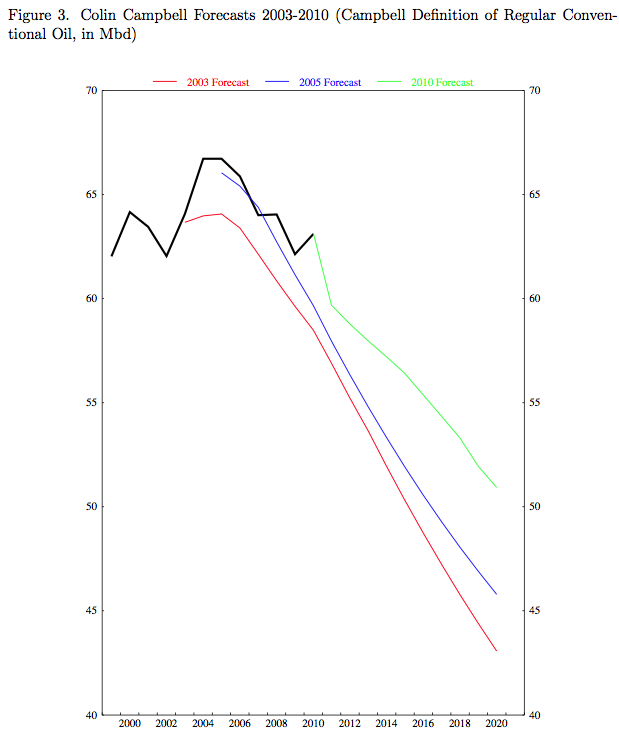
Models Based on the Geological View. The paper considers forecasts of oil supply such as those of Colin Campbell (shown in ASPO-Ireland Newsletters) and forecasts based on Hubbert Linearization to be models based on the Geological View. The paper observes that forecasts of oil supply based on geological view have tended to be too low, but not by as big a margin as those made using the economic/technological approach. As an example, it gives the following graph of changes in forecasts by Colin Campbell.

Figure 2. Colin Campbell Forecasts of Future Oil Supply, from paper.
A review of the two methods by the IMF group indicates that neither works precisely as hoped, but each has some validity. While oil production did not rise as fast as the economic/technological view would predict, higher oil prices have allowed oil production to stay on more or less a plateau after 2005, rather than declining as predicted by geological methods. The new model in the IMF Working Paper combines indications from both points of view, using an approach that allows them to estimate the relative contribution of geological impacts vs higher prices.
How the Two Methods are Combined
The oil supply equation in the new model is set up so that there are two different ways that the forecast oil supply can change. There is a downward tug from oil depletion at the same time that there is an upward tug from oil prices. It is expected that in the short run, high prices will get producers to utilize spare capacity, and over a longer period (estimated at 4 to 6 years), it will get producers to add new capacity. I will not try to explain all the variables and coefficients, but the blended supply equation is

Figure 3. Oil Supply Equation
In the above equation, qt is the quantity of oil produced in year t and Qt is the cumulative quantity produced in year t, so the ratio qt / Qt produces the familiar downward-sloping line one sees in charts used for Hubbert Linearization. The first two terms to the right of the equal sign are the ones based on the geological approach to depletion. The later terms depend on pt, which is price of oil at the time “t”. Adding the pt terms tends to raise the line at later periods so it does not slope downward as quickly as if depletion were the only factor affecting the relationship.
Growth Rate of GDP
In the model, high oil prices have some impact on GDP, but as we will see in Figure 5, below, not very much. There are two places in modeling GDP where high oil prices come into play. The first is in the Potential Growth Rate of GDP. According to the paper,
Economic /Technological Approach. With the economic/ technological approach, the assumption is made that high oil prices will encourage substitution and/or new oil production. Because of this, high oil prices are not expected to persist. Instead, the most important consideration in determining future oil supply is the level of future demand. The level of future demand, in turn, is primarily driven by anticipated GDP growth, since world GDP growth and world oil production growth tend to be highly correlated.
In effect, models of this type assume that whatever oil supply is needed will be available; they don’t consider the possibility that geological considerations may limit oil supply over the long term. As an example of how well these models have worked for prediction, the paper shows a graph of historical EIA forecasts (Figure 1, below).

Figure 1. Graph showing that oil production forecasts by the US Energy Information Administration have been revised downward, year after year, from paper.
Each year, EIA’s forecasts have been adjusted downward, because actual oil supply growth was lower than forecast.
Models Based on the Geological View. The paper considers forecasts of oil supply such as those of Colin Campbell (shown in ASPO-Ireland Newsletters) and forecasts based on Hubbert Linearization to be models based on the Geological View. The paper observes that forecasts of oil supply based on geological view have tended to be too low, but not by as big a margin as those made using the economic/technological approach. As an example, it gives the following graph of changes in forecasts by Colin Campbell.

Figure 2. Colin Campbell Forecasts of Future Oil Supply, from paper.
A review of the two methods by the IMF group indicates that neither works precisely as hoped, but each has some validity. While oil production did not rise as fast as the economic/technological view would predict, higher oil prices have allowed oil production to stay on more or less a plateau after 2005, rather than declining as predicted by geological methods. The new model in the IMF Working Paper combines indications from both points of view, using an approach that allows them to estimate the relative contribution of geological impacts vs higher prices.
How the Two Methods are Combined
The oil supply equation in the new model is set up so that there are two different ways that the forecast oil supply can change. There is a downward tug from oil depletion at the same time that there is an upward tug from oil prices. It is expected that in the short run, high prices will get producers to utilize spare capacity, and over a longer period (estimated at 4 to 6 years), it will get producers to add new capacity. I will not try to explain all the variables and coefficients, but the blended supply equation is

Figure 3. Oil Supply Equation
In the above equation, qt is the quantity of oil produced in year t and Qt is the cumulative quantity produced in year t, so the ratio qt / Qt produces the familiar downward-sloping line one sees in charts used for Hubbert Linearization. The first two terms to the right of the equal sign are the ones based on the geological approach to depletion. The later terms depend on pt, which is price of oil at the time “t”. Adding the pt terms tends to raise the line at later periods so it does not slope downward as quickly as if depletion were the only factor affecting the relationship.
Growth Rate of GDP
In the model, high oil prices have some impact on GDP, but as we will see in Figure 5, below, not very much. There are two places in modeling GDP where high oil prices come into play. The first is in the Potential Growth Rate of GDP. According to the paper,


